Point & Figure Chart
Point & Figure (P&F) charts have been used as far back as the late 1800's. This charting method focuses on price changes by eliminating time and volume; informing traders where price is relative to prior levels. Keeping this in mind, traders can decide whether today's price represents a continuation of a trend, a reversal or a breakout so that they may profitably trade the market tomorrow. In addition, Point & Figure charts filters out time and insignificant price changes, leaving you with a chart that contains only price movements that are relevant to you.
![]() Access from a Chart Analysis window using the Style
> Point & Figure menu sequence. To customize, use the Style > Customize menu sequence and select the Settings tab
Access from a Chart Analysis window using the Style
> Point & Figure menu sequence. To customize, use the Style > Customize menu sequence and select the Settings tab
These chart types differ from bar charts in two important ways:
- Price reversals below a user-defined minimum value are not shown - thereby filtering out price static.
- The time scale is variable; meaning the intervals on the horizontal axis vary. Therefore, a Point & Figure chart represents pure price movement.
Price changes are plotted as a series of vertical columns where up-trends are displayed as a column of Xs and down-trends are displayed as a column of Os. A column of Xs shows that demand is exceeding supply (a rally), and a column of Os shows that supply is exceeding demand (a decline).
How a Point & Figure Chart is Built
Point & Figure charts can be built based using the High/Low Range or the Close of the underlying data.
High/Low Range Basis
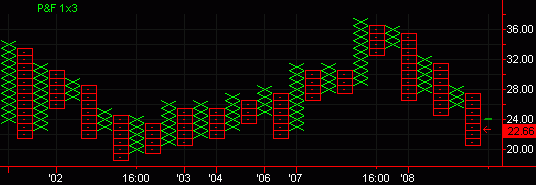
This construction method uses the High or the Low depending on the direction of the price. On rising days the high range is used for the calculation. On falling days, the low range is used. This method tends to highlight bullish or bearish sentiment. See ![]() How is the High/Low Range Constructed? for more details. Please note that this is the method used to build Point & Figure charts in prior versions of TradeStation.
How is the High/Low Range Constructed? for more details. Please note that this is the method used to build Point & Figure charts in prior versions of TradeStation.
Point & Figure chart using a monthly interval based on High/Low range:
Close Basis
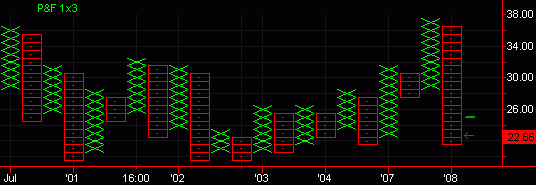
This construction method uses takes the latest price as it is received and compares it to the last X or O plotted. If the Close confirms the current direction, the current direction continues. If the Close retraces the current direction by the Reversal amount or greater, a new column is created in the reverse direction. Thus, it uses the last price it receives either to continue with the current column or to create a new column if the price reverses by the prescribed amount. See ![]() How is the Close Constructed? for more details.
How is the Close Constructed? for more details.
Point & Figure chart using a weekly interval based on a Close range:
Point & Figure Interval Settings
When creating a Point & Figure chart, you must specify the following settings:
- Box Size - The Box Size refers to the minimum increase or decrease in price needed to add an X or an O to a column of Xs or Os, respectively. For example, if you believe a half a point increase is significant, you can set this box size to 0.5. In a column of Xs, each time the price increases by .5, an X is added. In a column of Os, each time the price decreases by .5, an O is added.
The Box Size must be greater than the min. movement for the symbol, and should be evenly divisible by the min. movement or rounding errors may occur. - Reversal Amount - The Reversal Amount refers to the change in price, either up or down, needed to create a new column; in other words, reverse from a column of Os to a column of Xs (and vice versa). As an example, if you believe a reversal of one and a half points is significant, and you have set your box size to .5, then you should set your reversal amount to 3 (0.5 x 3 = 1.5). For instance, a column of Xs is being plotted, the price declines by 1 point, then goes back up a point. In this case, nothing is plotted. Now, the price increases again by half a point. Another X is added. Then, the price declines by 1.5 points. In this case, a new column is started as one O is plotted.
- Interval - The Interval setting specifies the interval of the data used to build the Point & Figure chart. The appropriate interval depends on your market perspective. Users with a short-term perspective may benefit from using smaller intervals (more precision/noise). Users with a long-term perspective may benefit from larger intervals (less precision/noise).
- Basis - The Basis setting determines the method used to construct the Point & Figure chart. The 'High/Low Range' selection uses the High and Low of the underlying data to build the Point & Figure chart. The 'Close' selection uses only the Close of the underlying bar to build the Point & Figure chart.
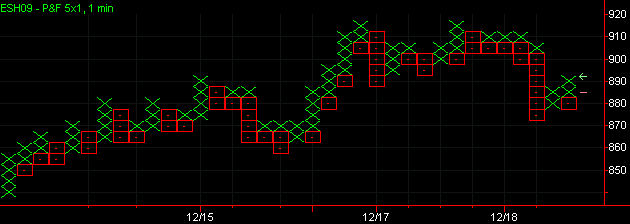
- One-Step-Back Column Building - The One-Step-Back selection is only applicable when the Reversal is set to 1. When enabled, this selection allows for an X and O to be plotted in the same column, in certain situations. This helps to consolidate price action when the Reversal is set to 1.
For example, during an up-trend (column of X's), if the prices were to retrace, creating a single O in the next column, and then resume its prior (opposite) direction, an X and an O will be displayed in the same column, as shown in the example below:
Point & Figure Chart Display
- The arrow displayed to the right of the current column indicates where the current price is located along the current column.
- The hash-mark displayed to the right of the current column indicates where prices need to get to in order for there to be a reversal.
- The dot displayed in the center of the O's indicates price at which the O is plotted. The price at which X's are plotted is indicated by the intersection of the lines.
Additional Information
- When using a Point & Figure chart, multi-data charts can not be created; only one symbol can be displayed on a Chart Analysis window at a time.
- You can apply almost any study to a Point & Figure chart, although you should not use studies that base their calculation methods on time.
- For X columns, the 'Up Vol' will reflect of number of X's in the column; for O columns, the 'Down Vol' will reflect the number of O's in the column.
![]() For a
comprehensive list of command line commands, see Command Line References (All Commands) or Command
Line Reference (Sorted by Application).
For a
comprehensive list of command line commands, see Command Line References (All Commands) or Command
Line Reference (Sorted by Application).
Related Topics
Point & Figure Chart Formations Library
Creating a Point & Figure Chart
Customizing a Point & Figure Chart