Momentum Bar Chart
Momentum bars are charted as standard vertical bars with opens, highs lows and closes, yet each bar has a specified price range, rather than being charted in units of time or ticks. With a focus on price movement, long periods of consolidation may be condensed into just a few bars, removing excess noise in the market and highlighting "real" price movements. So it is possible that an entire month of daily bars could fit into a single Momentum Bar, and the next month would have 30 Momentum Bars.
Momentum Bars are built by the underlying closing data that shows the directional trends as per the range amount. Momentum Bar charts are time independent so that time axis increments will not be fixed. The size of the bars will always be the range size set by you and will never be anything smaller or larger unless it is the current bar that is building.
![]() Access from a Chart Analysis window using the Style
> Momentum menu sequence. To customize, use the Style > Customize menu sequence and select the Settings tab
Access from a Chart Analysis window using the Style
> Momentum menu sequence. To customize, use the Style > Customize menu sequence and select the Settings tab
Momentum Bars look like standard bars, but are different in several ways:
- Momentum Bars are all equal in height, based on the Range specified by the user.
- Momentum Bar closes are always at the top or bottom of the bar.
- Momentum Bars charts have no gaps.
- The open of each Momentum Bar is always one price tick above or below the close of the previous Momentum Bar; since a new bar cannot be started until the specified Range is exceeded.
![]() This
is the primary difference between Momentum Bar and Range Bar charts.
This
is the primary difference between Momentum Bar and Range Bar charts.
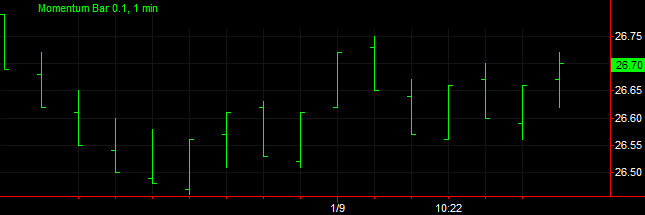
In this example, the Momentum Bar chart is using a price Range of .1 :
How a Momentum Bar is Built
Since Momentum Bars are driven by price movement, a new Momentum Bar is only created once the specified Range has been exceeded. For example, if the specified Range amount is $10, it means that each Momentum Bar will have a range (High to Low) of $10. It is thus conceivable that a single Momentum Bar could represent several days if the movement throughout those days was only within a $10 price range. Once a Momentum Bar is closed-out, the open of the next Momentum Bar will always be one tick above or below the close of the prior Momentum Bar.
There are no gaps displayed on Momentum Bar charts, so when there is a price gap in the underlying data, "virtual bars" will be inserted as necessary to fill in the gap on the Momentum Bar chart. These "virtual bars" can be easily distinguished from "real" Momentum Bars by their Up Volume and Down Volume values, which will both be zero. Note, in order for a bar to be considered a "virtual bar", there should be no real price activity contained within the bar.
Momentum Bar Interval Settings
The Range amount determines the size of the Momentum Bars on the chart. One should take careful consideration in the selection of the Range amount. As a rule, the specified Range amount should be greater than the normal oscillation of the underlying data. Selecting a Range amount that is too small will result in the creation of more bars in real-time than will be created when the chart is built historically.
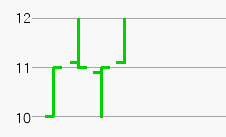
Suppose that within a given five minute period prices oscillate between 10 and 12, going from 10 to 12, then back to 10 and then back to 12. If the Range amount for this chart were set to 1, in real-time this would result in four Momentum Bars, as shown in the example below:
Since all of the aforementioned oscillations occurred within a five minute period (the specified underlying interval in this example) when the Momentum Bar chart is built historically, that five minute period would be represented by only two Momentum Bars, as shown in the example below:
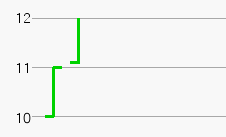
Only two bars would be displayed, since information about the bar oscillations within that five minute period would be unavailable when building the chart historically.
It is important that the Range amount be greater than the minimum move of the underlying symbol, and it should also be evenly divisible by the minimum move or rounding errors may occur.
The Interval setting specifies the interval of the data used to build the Momentum Bars. The appropriate interval depends on your market perspective. Users with a short-term perspective may benefit from using smaller intervals (more precision/noise). Users with a long-term perspective may benefit from larger intervals (less precision/noise).
Trading Interpretation
Momentum Bars interpretation is similar to that of traditional bar charts.
Strategy Back-testing & Automation
Strategies can be effectively back-tested and automated on Momentum Bar charts when using an appropriate Range value and a '1 Tick' underlying interval. Automating strategies on this chart type using higher underlying intervals will yield real-time results that are inconsistent with back-test results. For additional information on back-testing and automating strategies on Advanced Chart Types, see Advanced Chart Types - Strategy Back-Testing & Automation.
Additional Information
- When using a Momentum Bar chart, multi-data charts can not be created; only one symbol can be displayed on a Chart Analysis window at a time.
- Momentum Bar charts are not time-based;
they are built based on price activity. Thus,
- The lines on the chart will not necessarily represent the specified data interval or time period.
- Dates may not necessarily be evenly spaced across the time axis (x-axis).
- Studies and strategies can be applied to a Momentum Bar chart.
- Actual volume values are only displayed when '1 tick' is the selected interval for the Momentum Bar chart. Otherwise, the 'Up Vol' value will always equal 1. Volume for "virtual bars" will always be zero.
![]() For a
comprehensive list of command line commands, see Command Line References (All Commands) or Command
Line Reference (Sorted by Application).
For a
comprehensive list of command line commands, see Command Line References (All Commands) or Command
Line Reference (Sorted by Application).