Line Break Chart
The Line Break chart is a "more subtle form of point and figure charts, where reversals are decided by the market", as described by a Japanese trader. It is made up of a series of vertical blocks called lines, that use closing prices to indicate market direction.
Line Break charts are most commonly known as "three-line break" charts. This is because once there are three consecutive lines in the same direction, the Close must "break" the most recent three lines in order to draw a line in the opposite direction. For example, once there are three consecutive Up Lines, the Close would have to break below the low of the prior three Up Lines before a Down Line can be drawn.
![]() Access from a Chart Analysis window using the Style
> Line Break menu sequence. To customize, use the Style > Customize menu sequence and select the Settings tab
Access from a Chart Analysis window using the Style
> Line Break menu sequence. To customize, use the Style > Customize menu sequence and select the Settings tab
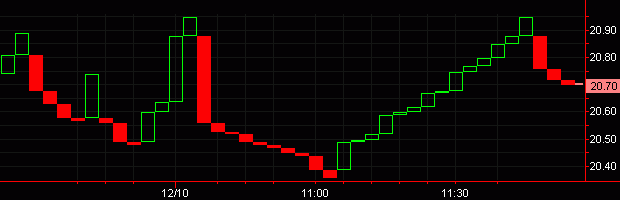
In this example, the Line Break chart shows 3 line breaks must be broken in order for a line in the opposite direction of the current trend can be drawn:
How a Line Break Chart is Built
Line Break charts are built by the addition of new lines, based on the position of the Close relative to the most recent Line high/low values.
- A new 'Up Line' is added if the Close of the current bar is greater than the high of the previous 'Up Line'.
- A downward reversal occurs only if the Close of the current bar is less than the Lows of the specified number of prior Line Break lines.
- An upward reversal occurs only if the Close of the current bar is greater than the Highs of the specified number of prior Line Break lines.
- A new 'Down Line' is added if the Close of the current bar is less than the low of the previous 'Down Line'.
- If there is no new high or low, no line is added.
Line Break Interval Settings
The Line Breaks value is the number of recent lines that the Close must "break" in order to draw a line in the opposite direction. Although 3 is the most common Line Breaks value, TradeStation allows you to use the 'Line Break' setting to specify any number of Line Breaks.
The Interval setting defines the interval of the data used to build the Line Break chart. The appropriate interval depends on your market perspective. Users with a short-term perspective may benefit from using smaller intervals (more precision/noise). Users with a long-term perspective may benefit from larger intervals (less precision/noise).
Trading Interpretation (when Line Break = 3)
- Buy when an Up Line emerges after three or more consecutive Down Lines.
- Sell when a Down Line emerges after three or more consecutive Up Lines.
- Avoid trading in "trendless" markets, where the Up Lines and Down Lines alternate.
Strategy Back-testing & Automation
Strategies can be effectively back-tested and automated on Line Break charts, only when the applied strategy uses "on Close" orders (ex. Buy this bar on Close). When automating a strategy on a Line Break chart, you should choose the smallest possible underlying interval. For additional information on back-testing and automating strategies on Advanced Chart Types, see Advanced Chart Types - Strategy Back-Testing & Automation.
Additional Information
- When using a Line Break chart, multi-data charts can not be created; only one symbol can be displayed on a Chart Analysis window at a time.
- Line Break charts are not time-based; they are built based on price activity.
- The lines on the chart will not necessarily represent the specified data interval or time period.
- Dates may not necessarily be evenly spaced across the time axis (x-axis).
- Studies and strategies can be applied to a Line Break chart.
- Actual volume values are only displayed when '1 tick' is the selected interval. Otherwise, the 'Up Vol' value equals one for Up Lines; 'Down Vol' value equals one for Down Lines.
![]() For a
comprehensive list of command line commands, see Command Line References (All Commands) or Command Line Reference (Sorted by Application).
For a
comprehensive list of command line commands, see Command Line References (All Commands) or Command Line Reference (Sorted by Application).