Kagi Chart
Kagi charts were created in the 1870's when the Japanese stock market started trading. Kagi charts displays a series of connecting vertical lines whose thickness and direction are dependent on what is happening in the market. In TradeStation, the Kagi reversal amount can be specified as a fixed price or percentage.
![]() Access from a Chart Analysis window using the Style
> Kagi menu sequence. To customize, use the Style > Customize menu sequence and select the Settings tab
Access from a Chart Analysis window using the Style
> Kagi menu sequence. To customize, use the Style > Customize menu sequence and select the Settings tab
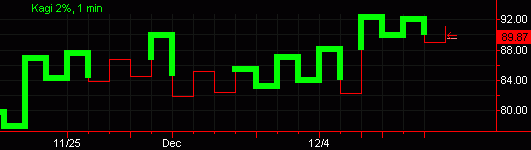
In this example, the Kagi chart is using a 2% reversal:
How a Kagi Line is Built
- When the market moves in the same direction of a prior Kagi line, the line will be extended.
- When the market moves in the opposite direction by at least the reversal amount, a new Kagi line in the opposite direction will be displayed.
- The color and width of the Kagi line changes when the Kagi line breaks a prior high or low.
Kagi Interval Settings
The Reversal amount is the minimum price movement needed for a new reversal line to be drawn in the Kagi chart. A fixed price or a percentage can be specified for the Reversal amount. The Reversal amount must be greater than the minimum move, and should be evenly divisible by the minimum move or rounding errors may occur.
The Interval setting defines the interval of the data used to build the Kagi Lines. The appropriate interval depends on your market perspective. Users with a short-term perspective may benefit from using smaller intervals (more precision/noise). Users with a long-term perspective may benefit from larger intervals (less precision/noise).
Kagi Chart Display
- The arrow displayed to the right of the current Kagi Line indicates where the current price is located on the current line.
- The hash-mark displayed to the right of the current Kagi Line indicates where prices need to retrace to in order for there to be a reversal.
Trading Interpretation
- A rally (series of thick lines) is defined as a condition in the market when the demand exceeds the supply.
- A decline (series of thin lines) is defined as a condition in the market when the supply exceeds the demand.
- A stable market is displayed by alternating thick and thin lines when the supply and demand are in balance.
Strategy Back-testing & Automation
Due to the construction definition of Kagi charts, the back-testing and automation of strategies is not recommended when using this chart type; unless the underlying interval is set to '1 Tick' and stop/limit type orders are used, taking precautions to avoid placing these orders where they would be filled within the "reversal range". For additional information on back-testing and automating strategies on Advanced Chart Types, see Advanced Chart Types - Strategy Back-Testing & Automation.
Additional Information
- When using a Kagi chart, multi-data charts can not be created; only one symbol can be displayed on a Chart Analysis window at a time.
- Kagi charts are not time-based; they are
built based on price activity. Thus,
- The lines on the chart will not necessarily represent the specified data interval or time period.
- Dates may not necessarily be evenly spaced across the time axis (x-axis).
- Studies and strategies can be applied to a Kagi chart.
- Actual volume values are only displayed when '1 tick' is the selected interval. Otherwise, the 'Up Vol' value equals one for Thick Lines; 'Down Vol' value equals one for Thin Lines.
![]() For a
comprehensive list of command line commands, see Command Line References (All Commands) or Command
Line Reference (Sorted by Application).
For a
comprehensive list of command line commands, see Command Line References (All Commands) or Command
Line Reference (Sorted by Application).