TradeStation Help
Renko(+) Chart
The Renko(+) chart includes three different Renko chart types: the Classic Renko, the Mean Renko, and the Custom Renko.
The Renko charts are similar to a Line Break chart, except that in a Renko chart each brick is of a fixed equal size. Bricks are color-coded to indicate a trend. For example, a series of red bricks may indicate an up-trend. A series of blue bricks may represent a down-trend. Alternating red and blue bricks indicate a period of indecision in the market.
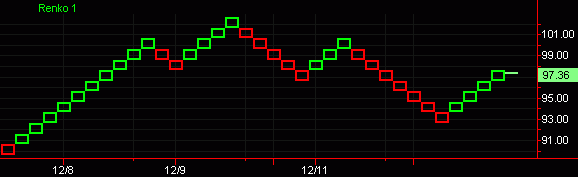
In a Classic Renko chart, a new brick can only be added in the direction of the current trend if the market has moved in that direction by at least a specified minimum amount, the Brick Size. A new brick can only be added in the direction opposite the current trend if the market moves opposite the current trend by that same minimum amount, the Brick Size, beyond the most recent brick.
In this example, the Classic Renko chart is using a Brick Size of 1:
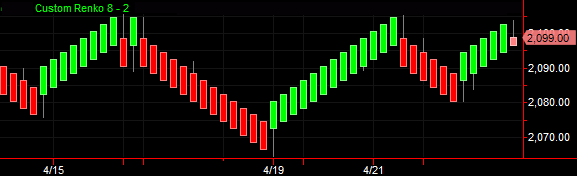
In a Mean Renko and Custom Renko, the direction in which a new brick is added is decided by the amount the market has moved above or below the open price of the current bar. If the market has moved at least the brick size above the open price of the new bar, then the new bar is drawn in the upward direction. If the market has moved at least the brick size below the open price of the new bar, then a bar is drawn in the downward direction.
The open price of the new bar is always set at a specified offset, the Brick Offset, from the open of the previous bar. You can define the offset used in the Custom Renko chart. For a Mean Renko, the offset is locked at half the brick size.
In this example, the Custom Renko chart uses a Brick Size of 8 and a Brick Offset of 2.
How a Classic Renko Chart is Built
- When the market moves in the same direction of the prior Renko brick, by the specified Brick Size, a new brick will be added in the same direction as the prior brick.
- When the market moves in the opposite direction of the prior brick, by the specified Brick Size, a new Renko brick will be added in the opposite direction of the prior brick.
- If there is no significant change in price, i.e., the price oscillates within the range of the last brick, no new bricks will be added.
How a Mean and Custom Renko Chart are Built
- The open price of the current bar is always set at a specified offset, the Brick Offset, from the open of the previous bar. The open price is set as soon as the previous bar is drawn, and the direction of the offset depends on the direction of the current trend.
- If the current trend is downward, the offset will be downward from the open of the previous bar.
- If the current trend is upward, the offset will be upward from the open of the previous bar.
- When the market moves above the new open price by a specified amount, the Brick Size, then the new bar is drawn in the upward direction.
- When the market moves below the new open price by a specified amount, the Brick Size, then the new bar is drawn in the downward direction.
- A tail will be drawn to record the lowest price reached before an up bar was drawn, and the highest price reached before a down bar was drawn.
- If there is no significant change in price, i.e., the price oscillates within the range of the last brick, no new bricks will be added.
Renko(+) Interval Settings
The Brick Size is the minimum price movement needed for a new brick to be drawn. The Brick Size must be greater than the minimum move, and should be evenly divisible by the minimum move or rounding errors may occur.
The Brick Offset defines the amount the open price of the new bar is offset from the open of the previous bar. Also, it specifies the difference in closing prices of a new bar and the previous bar, moving in the same direction.
Renko charts have a fixed interval setting of 1 Tick. As a result, loading longer range Renko charts may take some time. Since Renko charts are drawn using one tick, they may be limited to a 6 month time frame.
Trading Interpretation
- Trend reversals are signaled by the emergence of a different color brick.
- A rally is indicated by a series of red (default), upward bricks.
- A decline is indicated by a series of blue (default), downward bricks.
- A trendless price action is indicated by alternating red/blue (upward/downward) bricks.
Strategy Back-testing & Automation
Strategies can be effectively back-tested and automated on Renko charts only when the applied strategy uses "on Close" orders (ex., Buy this bar on Close). For additional information on back-testing and automating strategies on Advanced Chart Types, see Advanced Chart Types - Strategy Back-Testing & Automation.
Additional Information
- When using a Renko(+) chart, multi-data charts can not be created; only one symbol can be displayed on a Chart Analysis window at a time.
- Renko(+) charts are not time-based; they are built based on price activity. Thus,
- The lines on the chart will not necessarily represent the specified data interval or time period.
- Dates may not necessarily be evenly spaced across the time axis (x-axis).
- Indicators and strategies can be applied to a Renko(+) chart.
- Actual volume values are displayed for each Renko(+) brick.
 For a comprehensive list of command line commands, see Command Line References (All Commands) or Command Line Reference (Sorted by Application).