
TradeStation Help
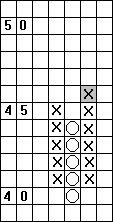
The Double Top formation is a chart pattern found in a bull market where the price rises above the top of the previous up column (Xs). In the example below, the Double Top occurred after the market bottomed out at 40. The subsequent increase in price is higher than the first, indicating a buy opportunity.
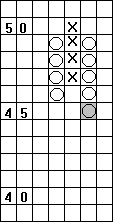
The Double Bottom formation is a chart pattern found in a bear market where the price breaks below the previous down column (Os). In the example below, a Double Bottom occurred after the market peaked at 50. The second decrease dropped further than the first, resulting in an indication to sell.
| Double Top Formation | Double Bottom Formation |
|---|---|

|

|